
Allure TestOps Hands-On Part 5: Dashboards
Testing in DevOps is not a trivial process, as it requires continuous testing, automated analysis, and fast-paced release verification. So TestOps, being a subset of DevOps focused on these tasks, is a set of technologies and approaches that brings testing documentation automation, test execution on CI/C, full control over automated testing via reporting, and defect management.
This is the fifth (and the last) post in a series. Today, we’ll talk about how to build flexible and insightful real-time dashboards covering any of your needs with Allure TestOps.
Why is it important? Well, that’s simple. We run tests to be sure that everything works fine both in terms of product and testing infrastructure health. With the right data slices and views, it becomes possible in a single glance.
Analytics: Dashboards and widgets
Dashboards and widgets help users understand what is happening with your testing:
- what is the situation with fail/pass rates
- which components/services run green or red
- how long does it take for tests to be executed
- how engineers perform
Create custom dashboards
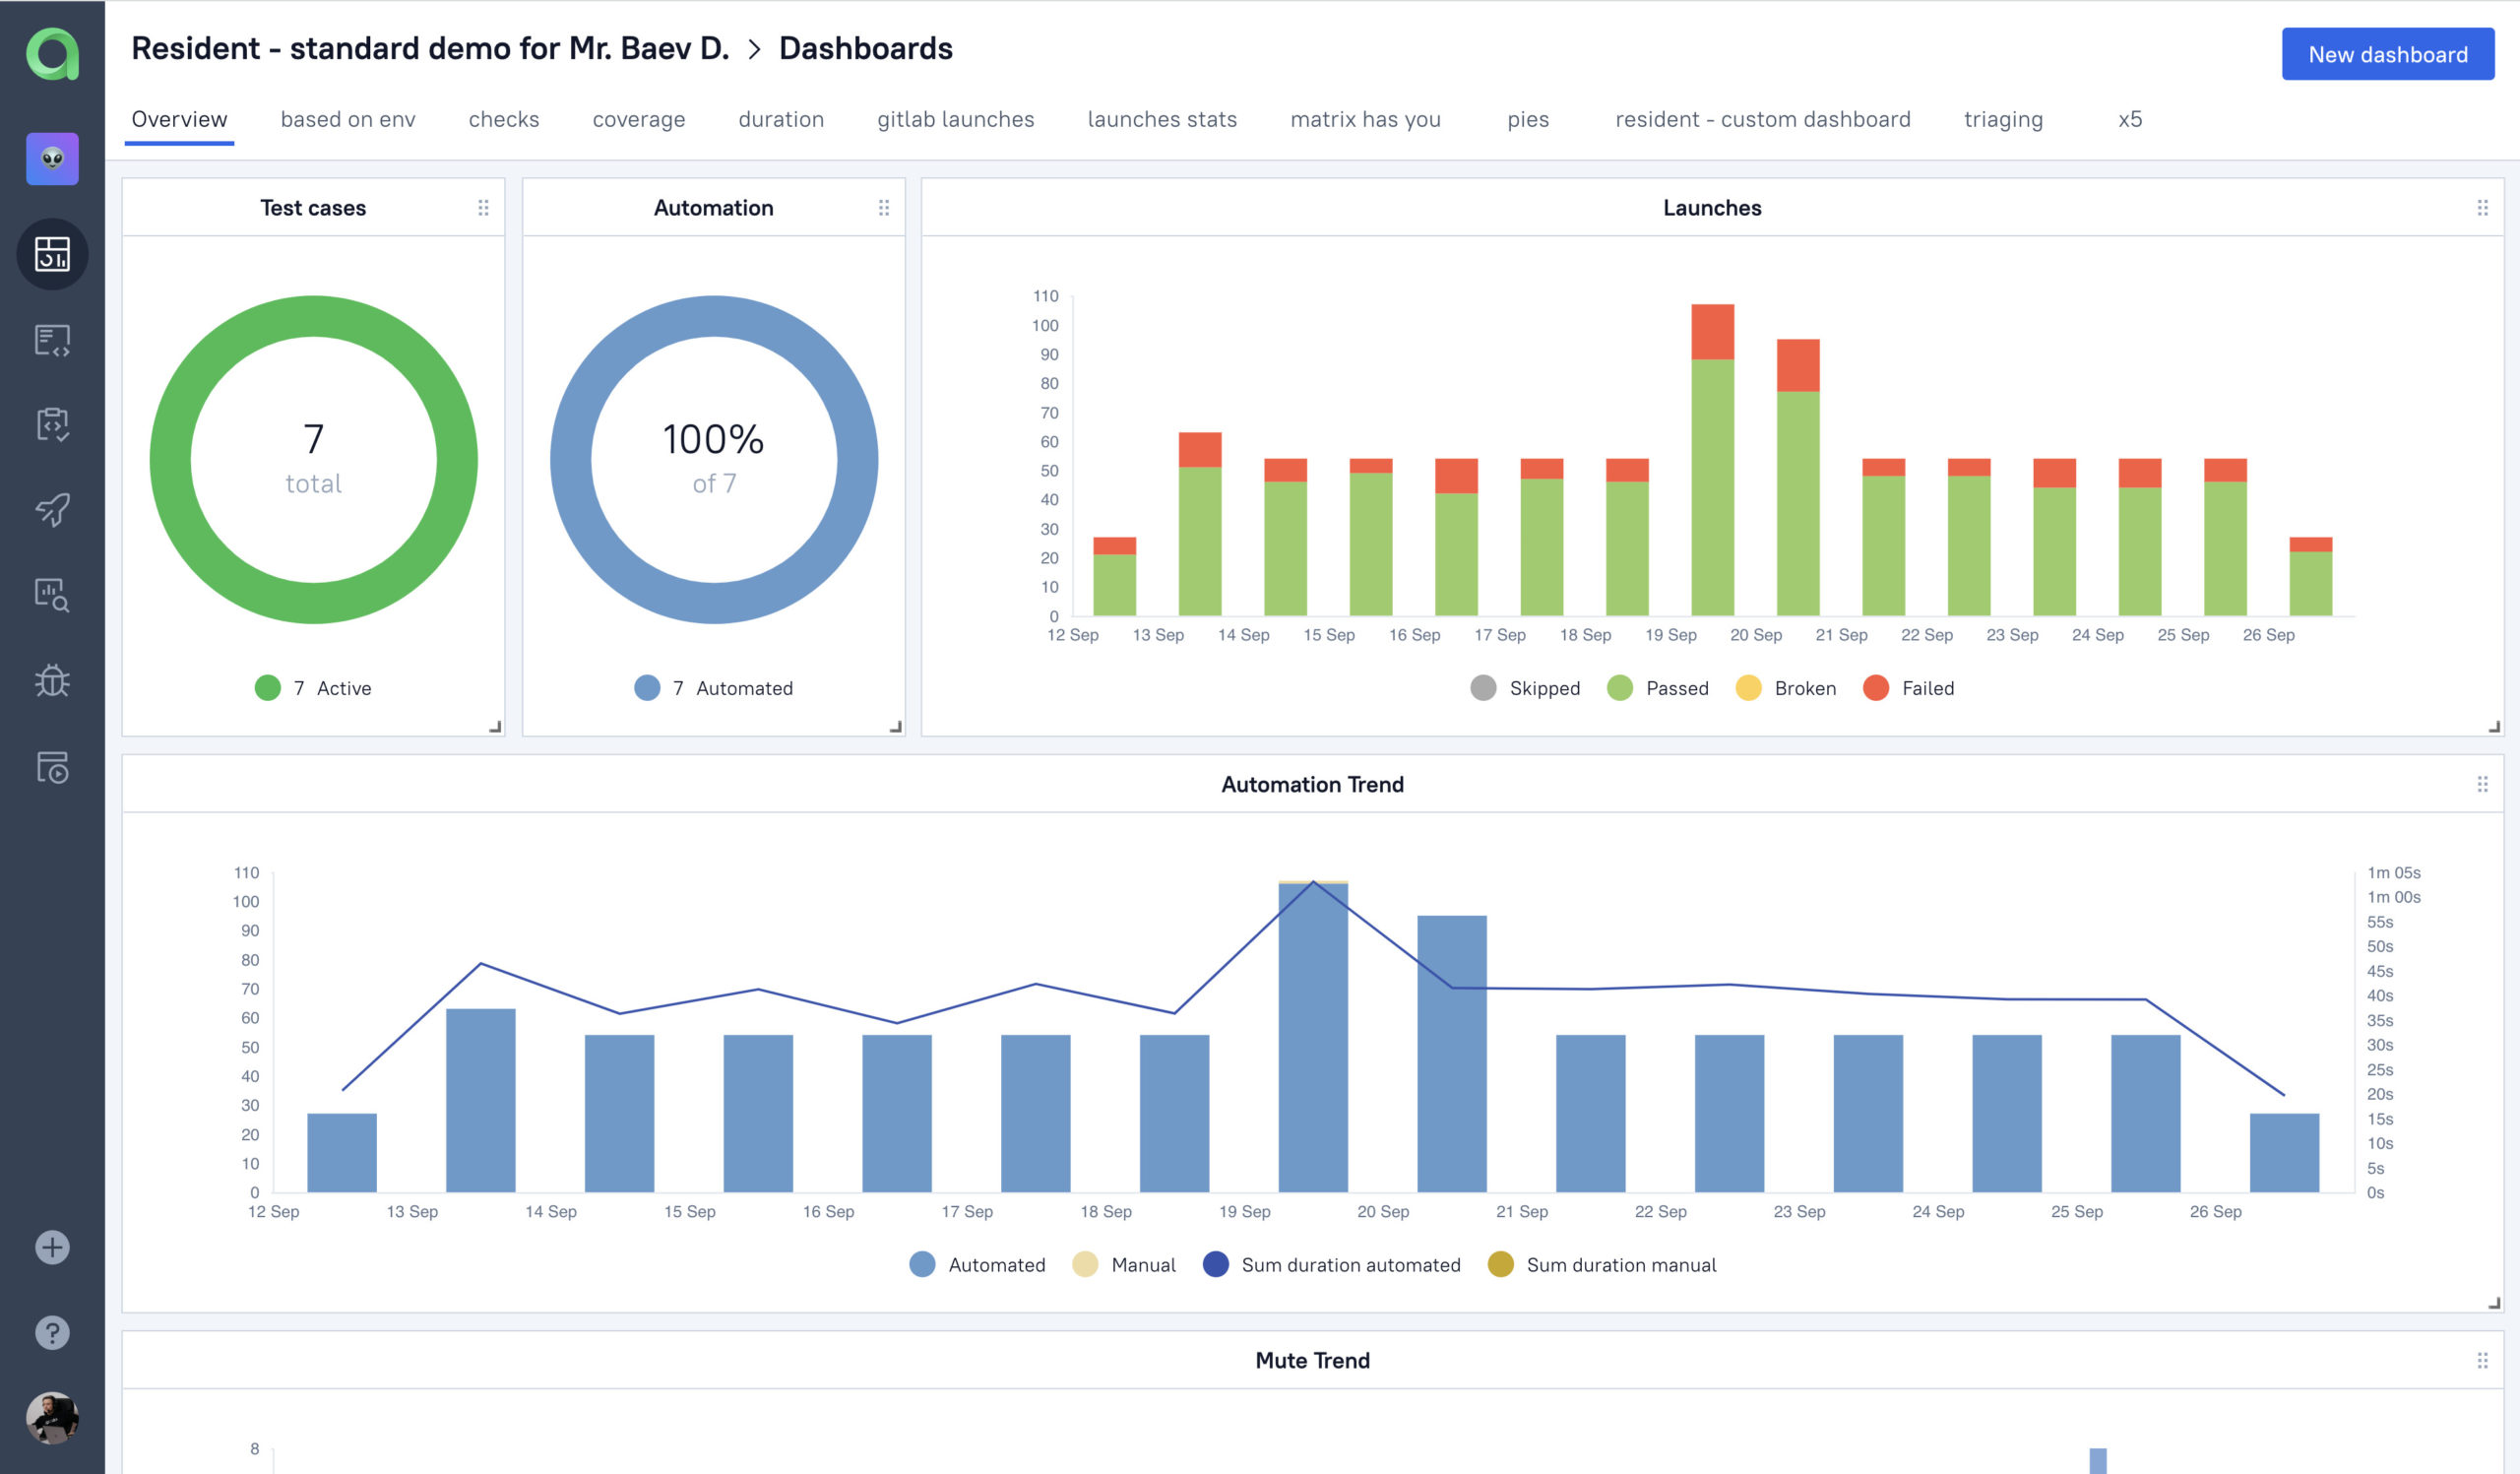
In each project you have this dashboard with an overview, that shows your lay of the land. Total number of test cases, automation rate and trend, launch stats, and the ‘muted test’ dynamics. But that is just the tip of the iceberg.
To drill down to some specific metrics, we should create a custom dashboard and add more widgets!
For example, we need to understand the number of tests created by some specific developer. To do that, we create a pie chart widget grouped by an automation rule. The rule is defined in AQL (Allure TestOps Query Language), our own JIRA-like query language that brings flexibility and performance to Allure TestOps Dashboards.
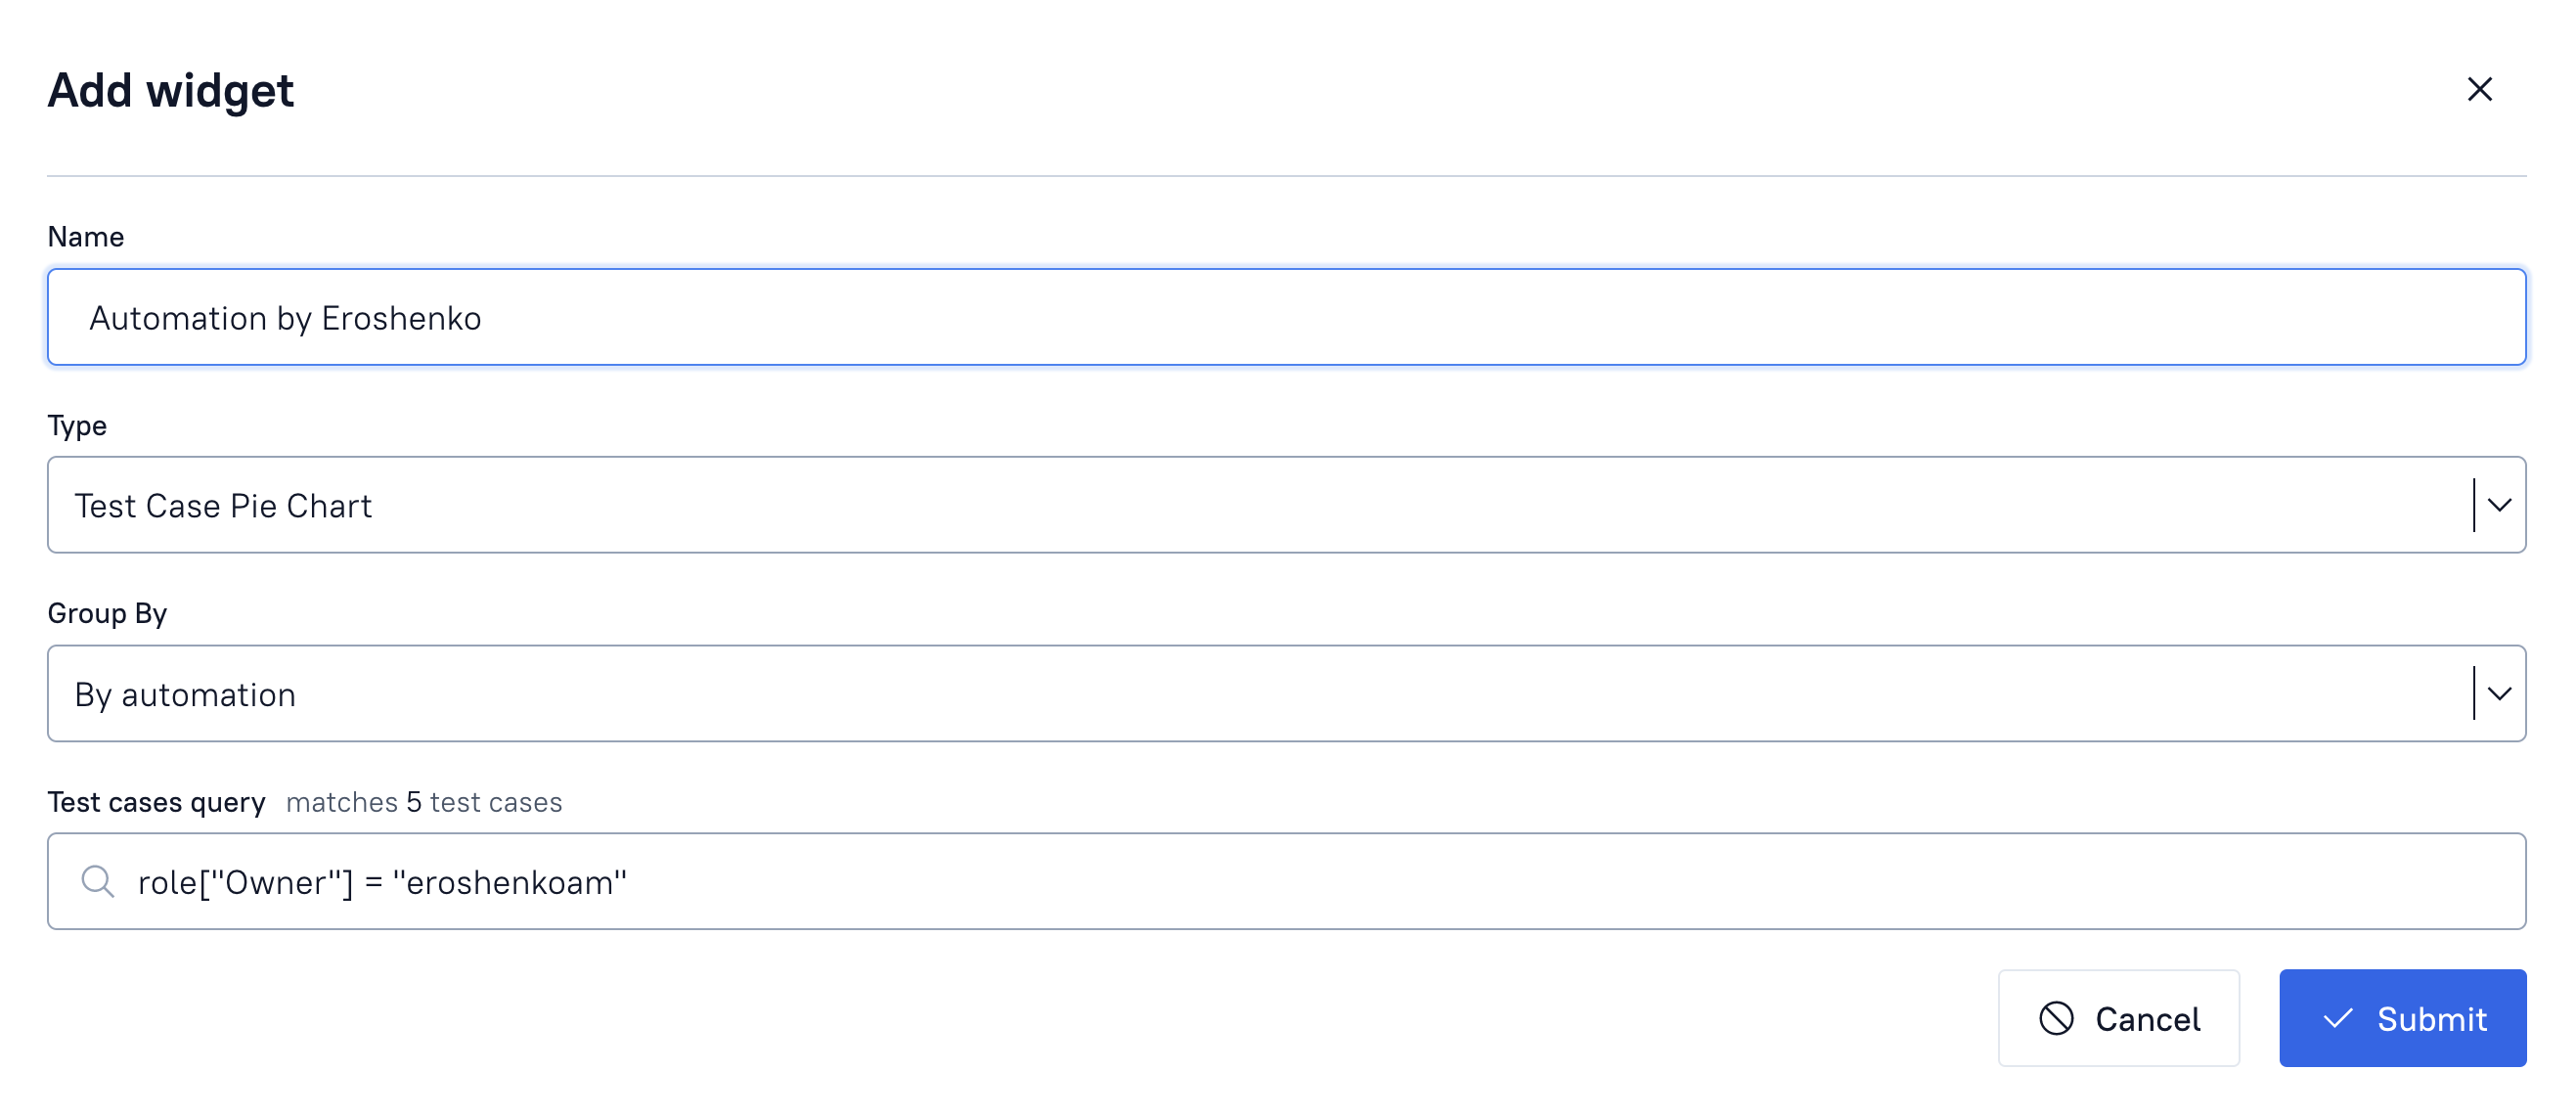
So this query gets us test cases stats that we can filter by role. In our project, the role is defined by owner field, let’s see how many tests are maintained by eroshenkoam. Query completed, you see, that the test case is matching this request. Submit.
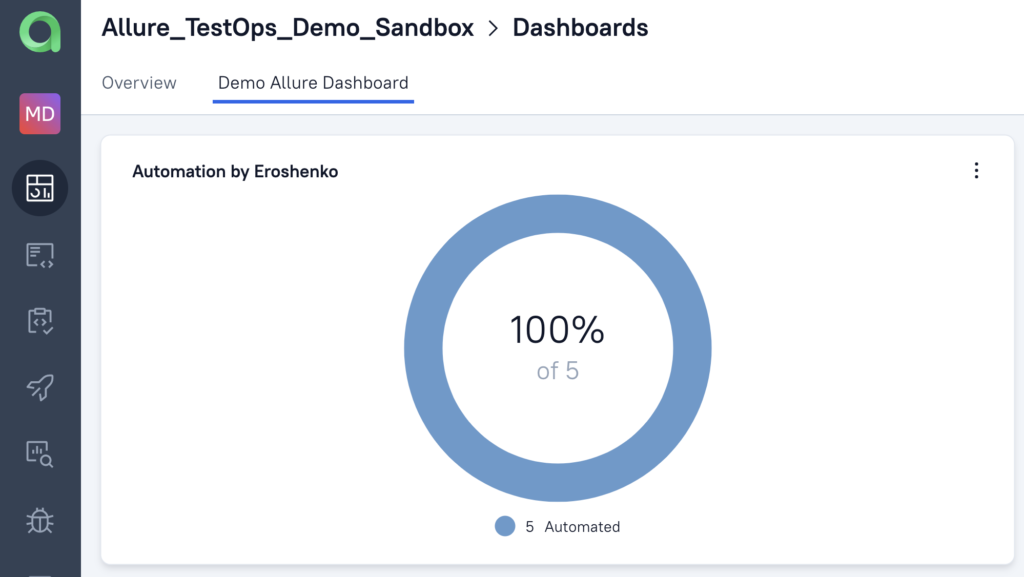
Building other “Owner-based” widgets is even simpler: just clone the original one and change the value in the automation rule. Okay, we can see the stats for our people’s efficiency. What’s next?
We should take a look at pass/fail rates for test cases and focus on those that fail frequently. Why? Well, because we need data to make our testing better. And when we think of improving stuff, we should focus on the worst cases!
To create the “worst test cases” widget, we should use the “Top Test Cases” template with Success metric. Let’s make some competition and filter tests by the owner to see whose tests run better! Widgets can be rearranged by drag&drop on the dashboard to get the clear and tidy picture like this:
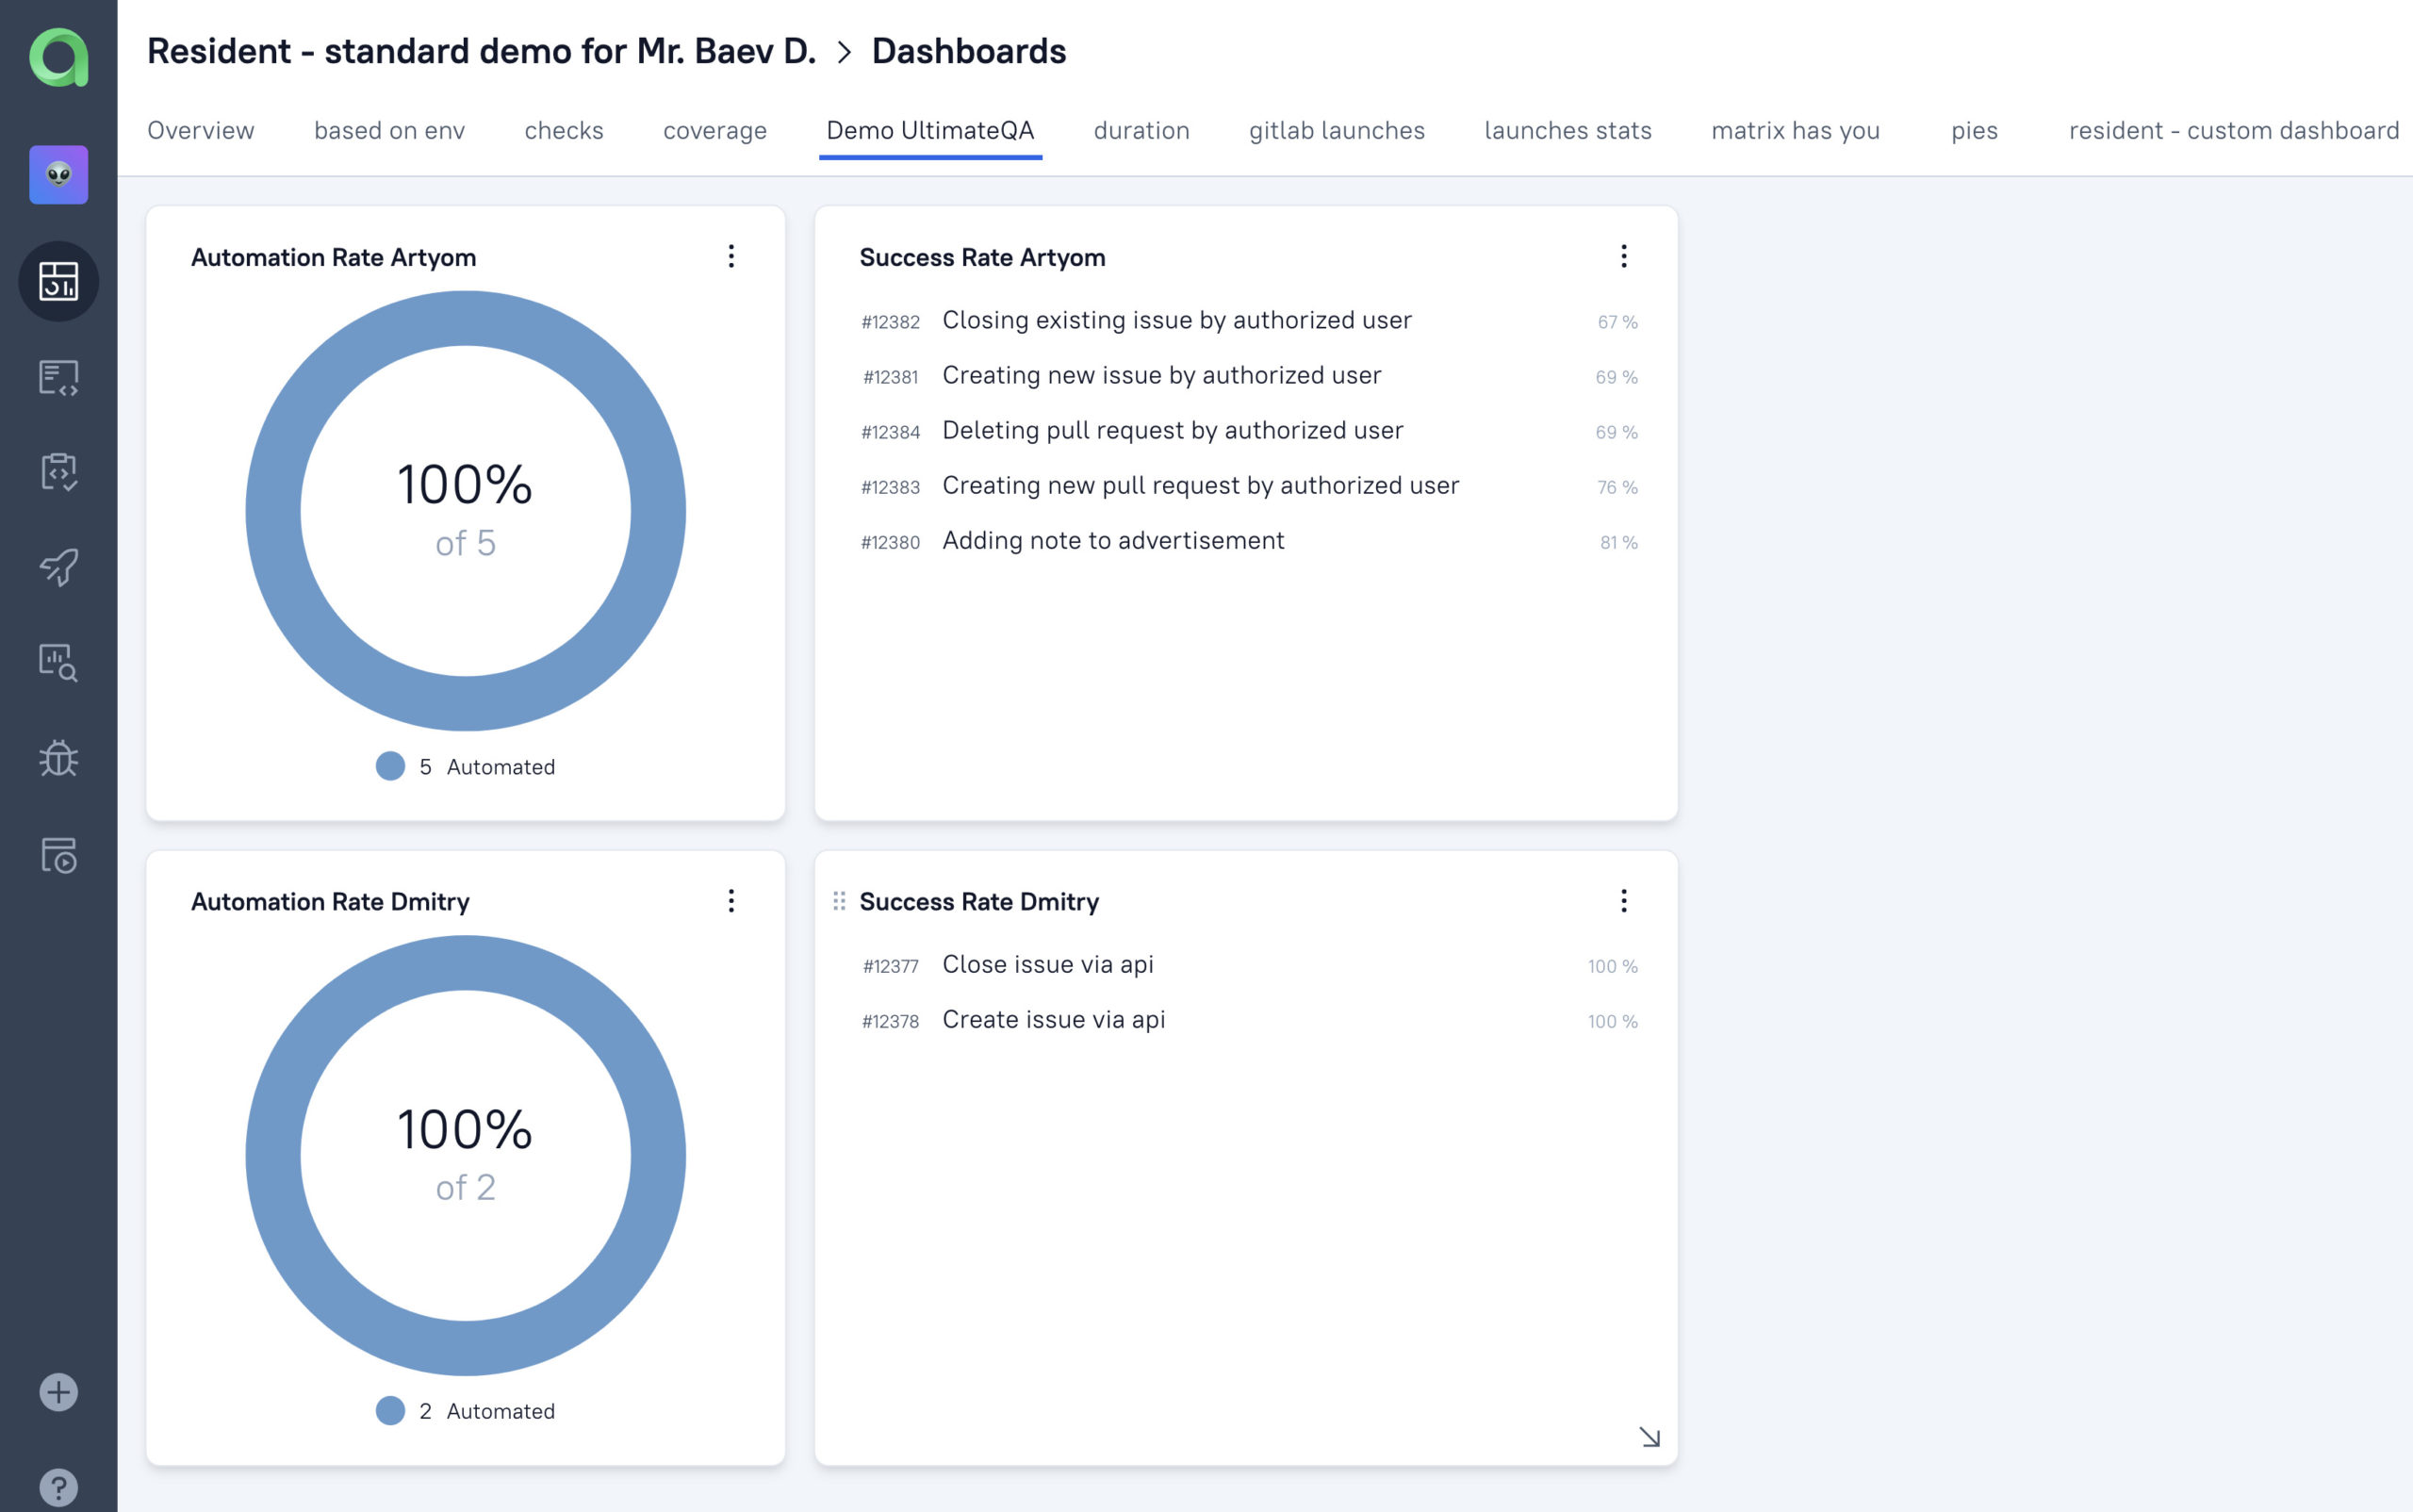
There are failing tests with the success rate from 67% to 81%. That means, we should keep our attention to tests with a smaller number, as they will likely find an issue or be broken/outdated.
But our second developer’s tests have a 100% success rate. This might mean one of two things, either the tests are completely green or they don’t test anything! Always stay suspicious of perfect results, right?
To finish the dashboard for ‘testing quality per engineer’, let’s find out how much time and effort it takes to run their tests. The Test Case Duration widget will help us with that! As soon as we clone the widgets, rename them and pick a duration metric as a source, we get two more fancy tables on the screen:
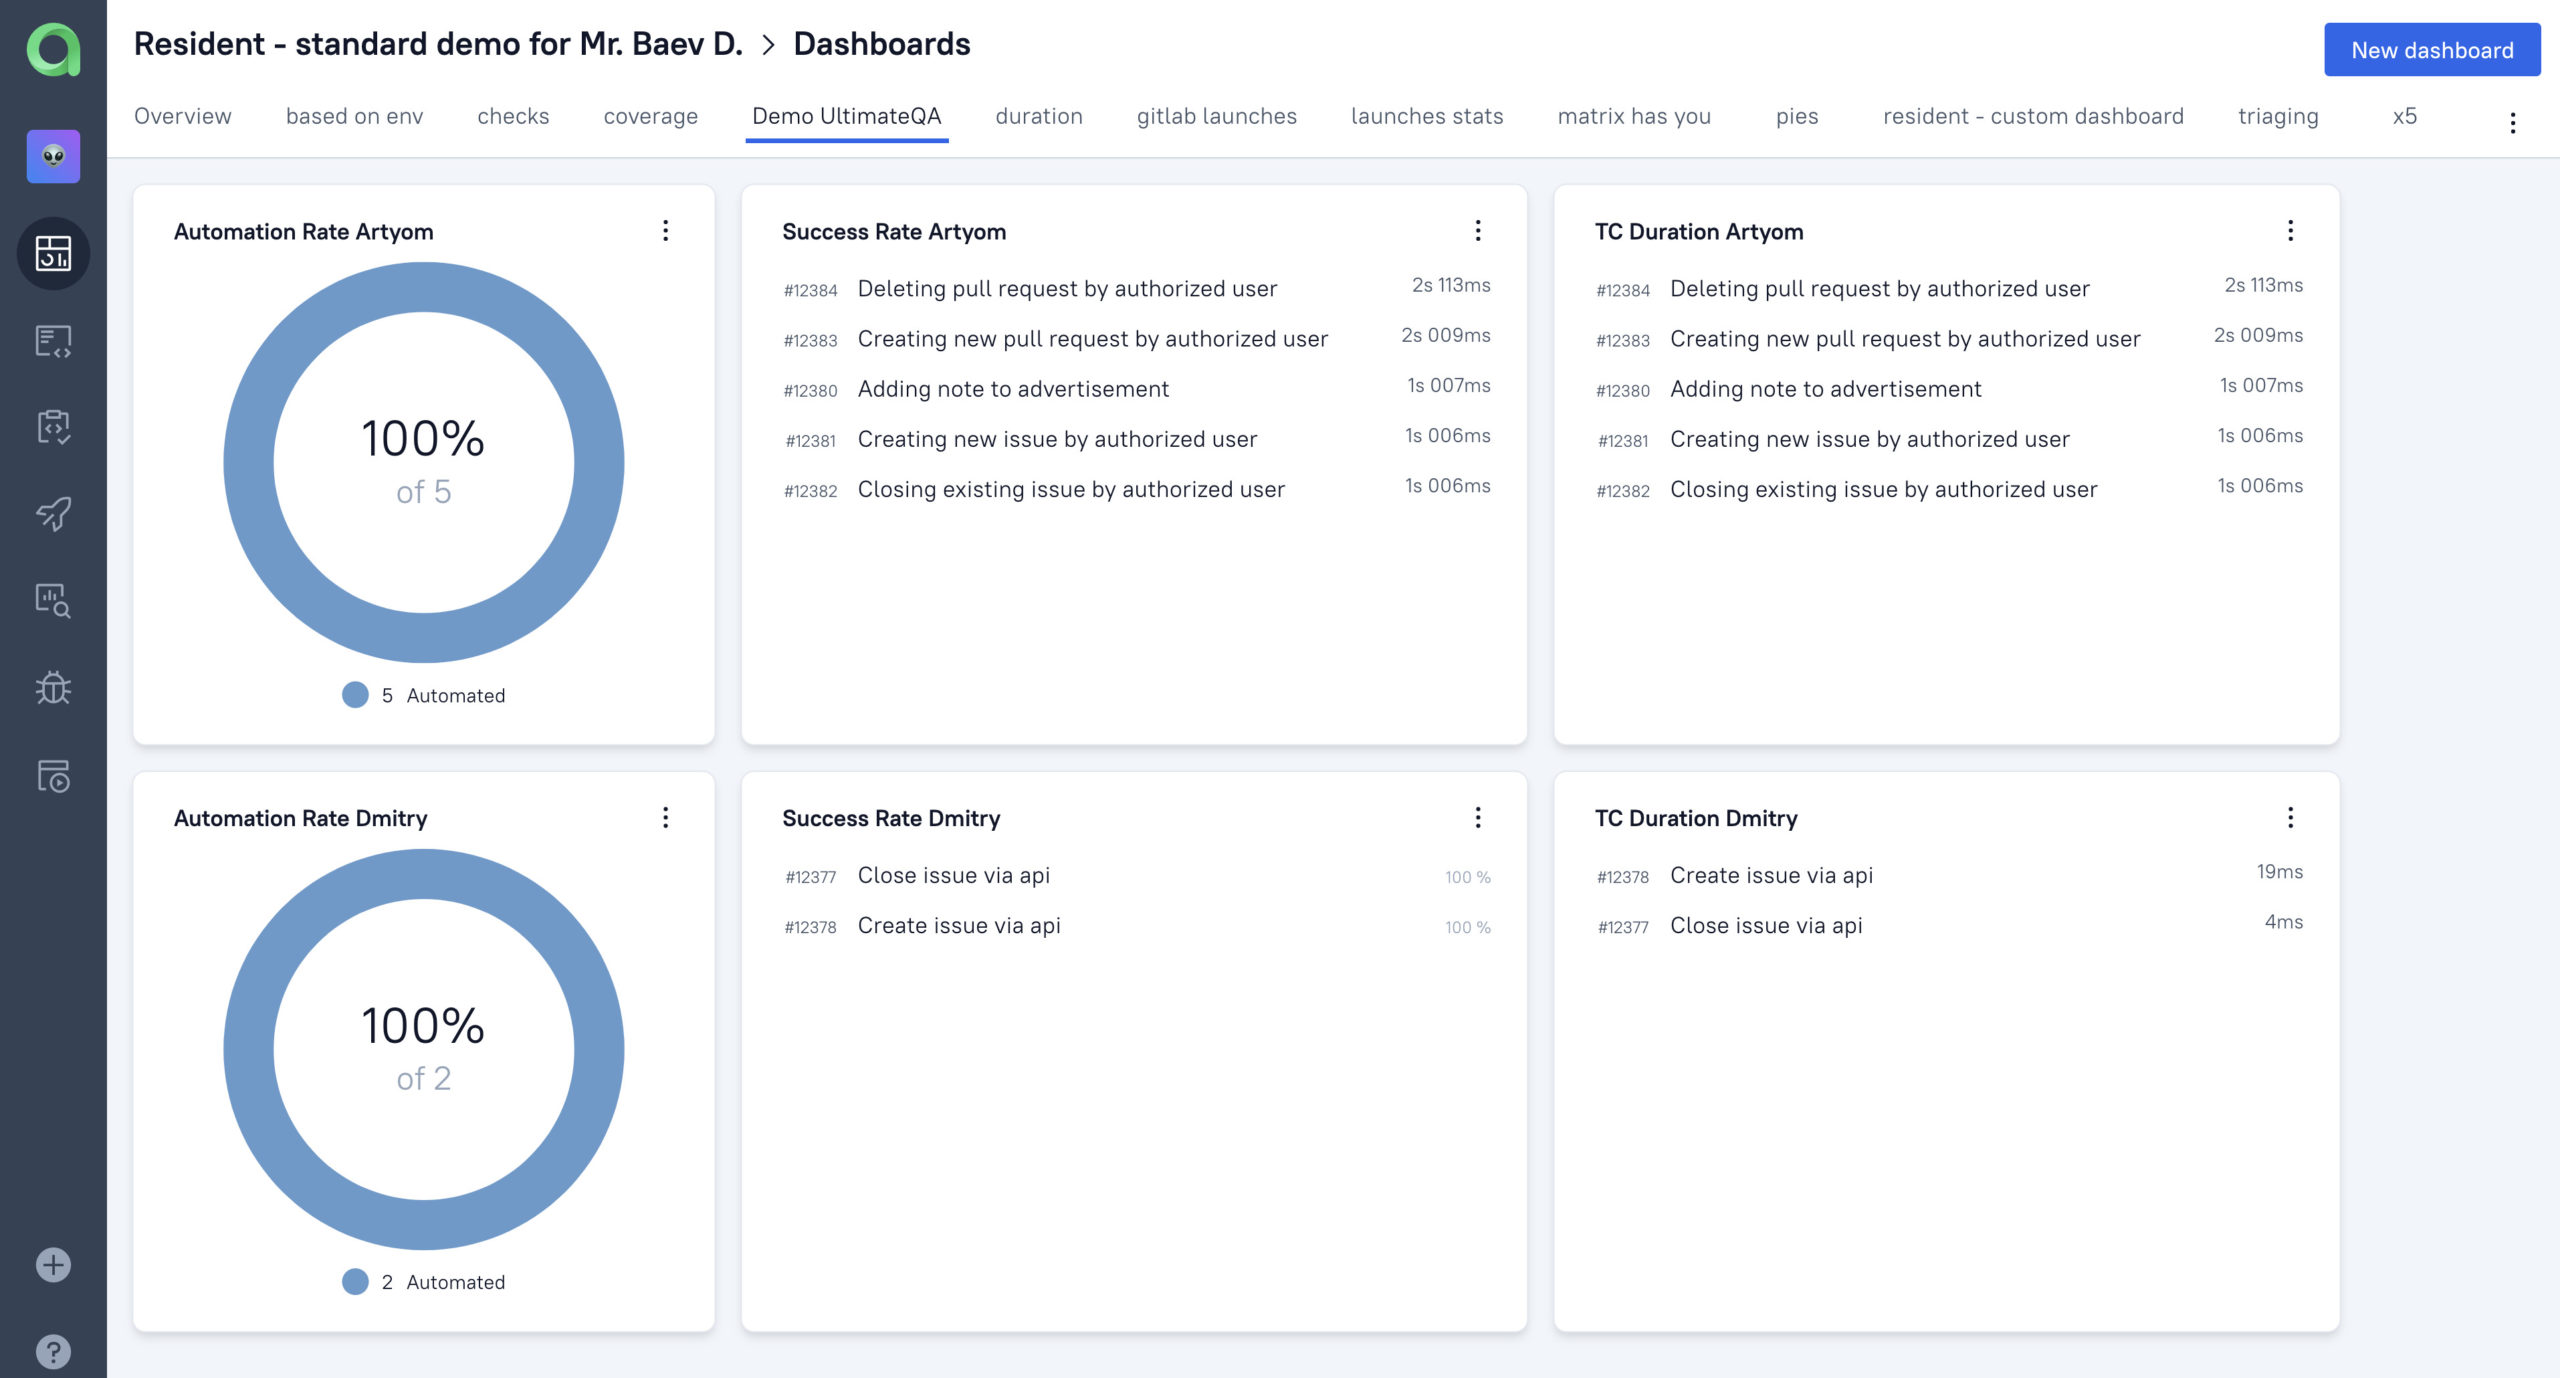
With that, it’s quite easy to get first ideas of what we should dig into with our QA team. Take a look at the longer-running often-falling tests for the start. Can we optimize them? What causes failures? Are they flaky or just broken?
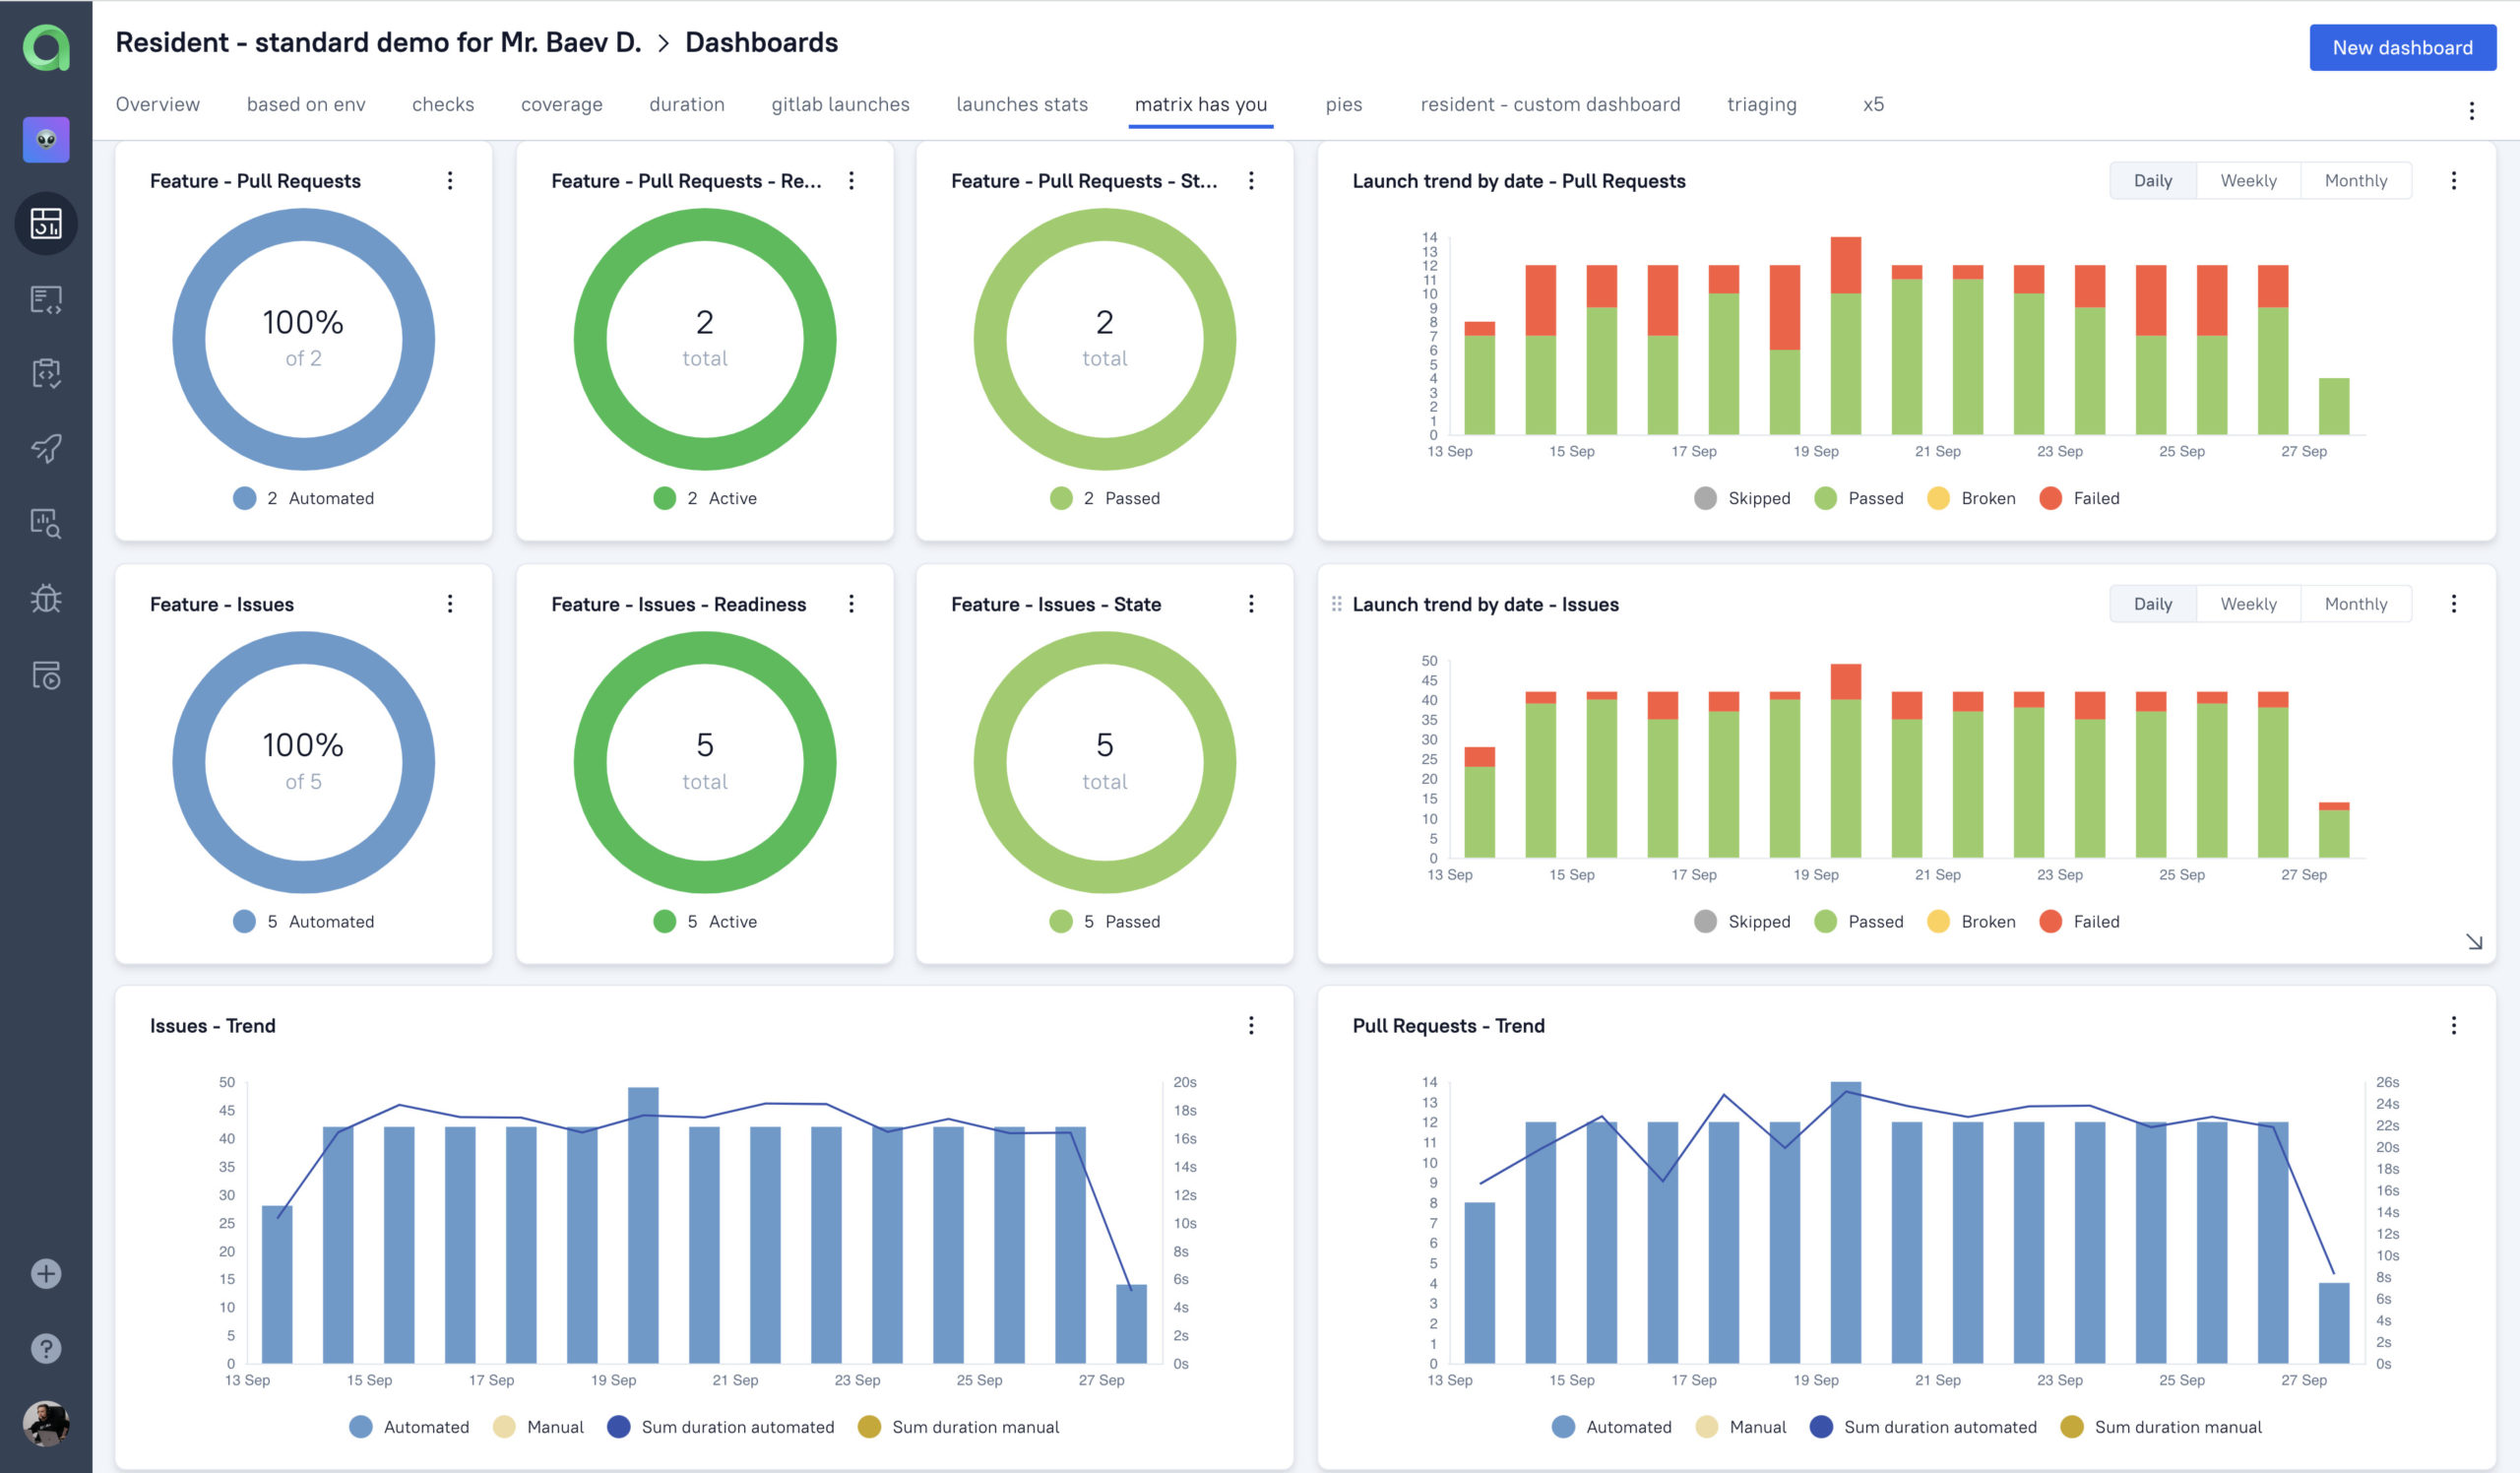
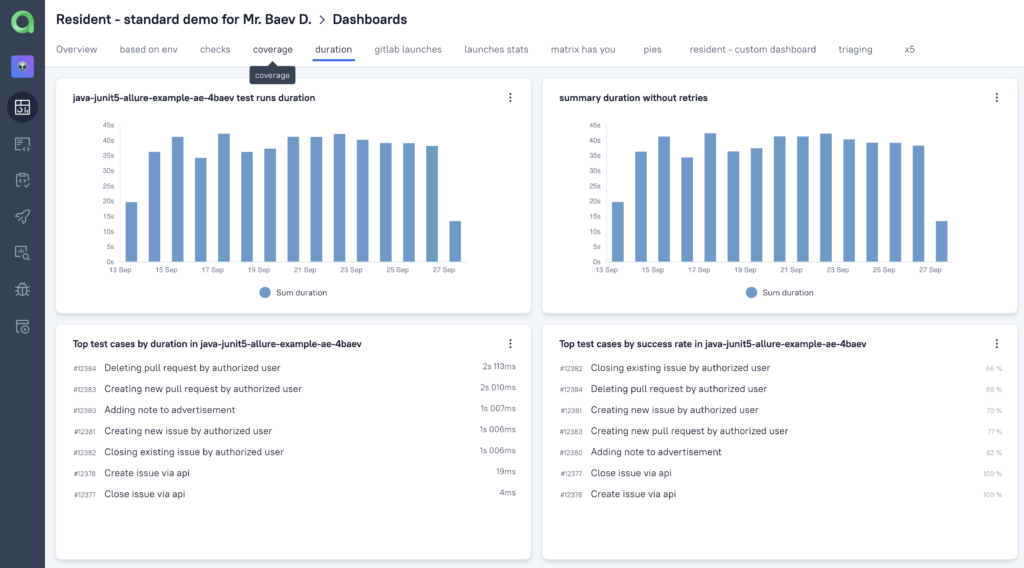
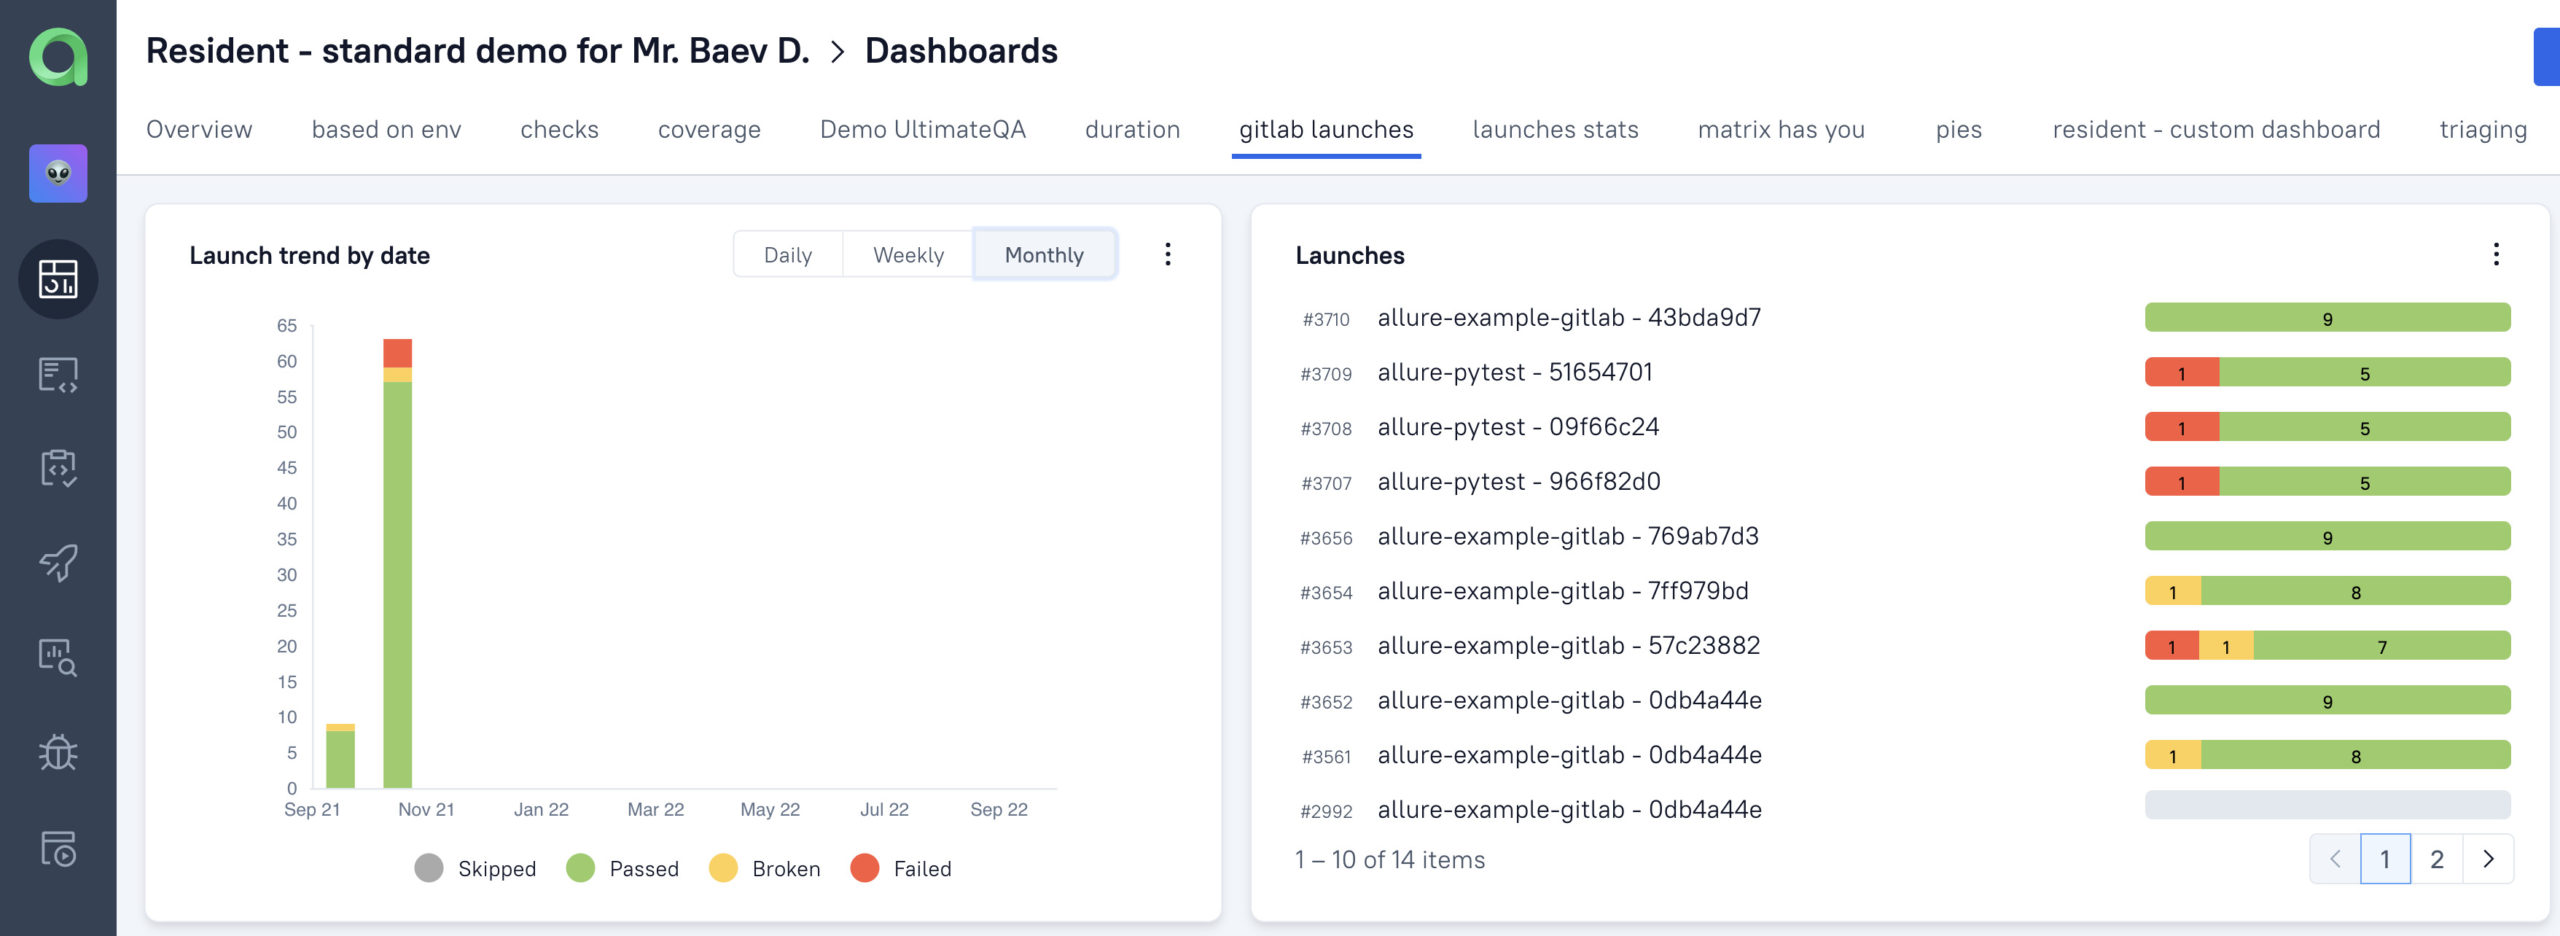
This demo was intended to show how easy you can create specific widgets, but the number of views and graphs in TestOps is huge. Here are some more views you may build in half-an-hour:
Try Allure TestOps Cloud
Qameta Software focuses on developing amazing tools that help software testers. Allure TestOps Cloud is available so you are in several clicks from giving the next-gen test case execution management a try!