
Introduction
Azure DevOps provides a comprehensive ecosystem for software development teams, offering a wide array of capabilities including version control, project planning, build automation, testing, and release management. The platform also includes support for dashboarding, which provides the ability to visually represent data from a project. This article will guide you on how to create dashboards of test results in Azure DevOps. It will be useful for you if you use Azure Pipelines to run tests.
What are Azure DevOps Dashboards?
Dashboards in Azure DevOps are customizable interactive signboards that provide real-time information, analytics, and insights of the project. They allow team members to monitor metrics, view progress across multiple projects, and track key performance indicators. Dashboards can display test results, work items, build and release statuses, and much more.
Why Use Dashboards for Test Results?
Using dashboards for displaying test results provides a clear and concise way to understand test performance at a glance. Dashboards can show test pass rates, test failure rates, test coverage, trends over time, and other key test metrics. This helps in making informed decisions, reduces the time taken to identify and respond to issues, and improves overall project efficiency.
Creating Dashboards for Test Results in Azure DevOps
Here are the steps to create dashboards for test results in Azure DevOps:
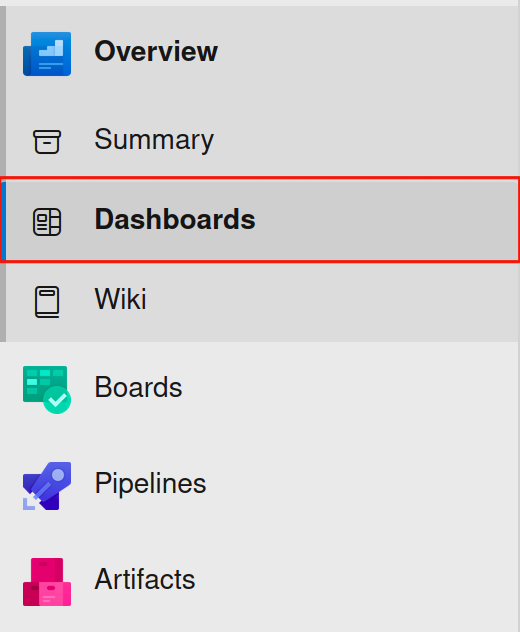
Log into Azure DevOps and select the project you want to create a dashboard. Once inside the project, click on the ‘Dashboards’ option located in the left-hand menu.
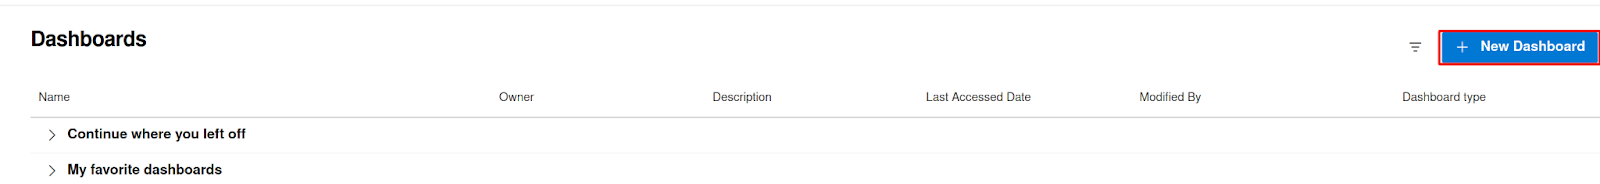
2. Create a New Dashboard
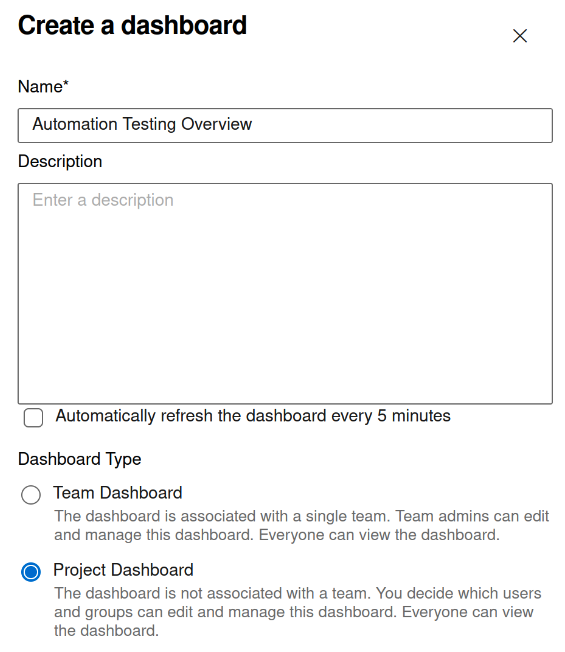
Click on the ‘New Dashboard’ button, provide a Name, Description, and Dashboard Type for your dashboard, and then click on ‘Create’.
3. Add Widgets
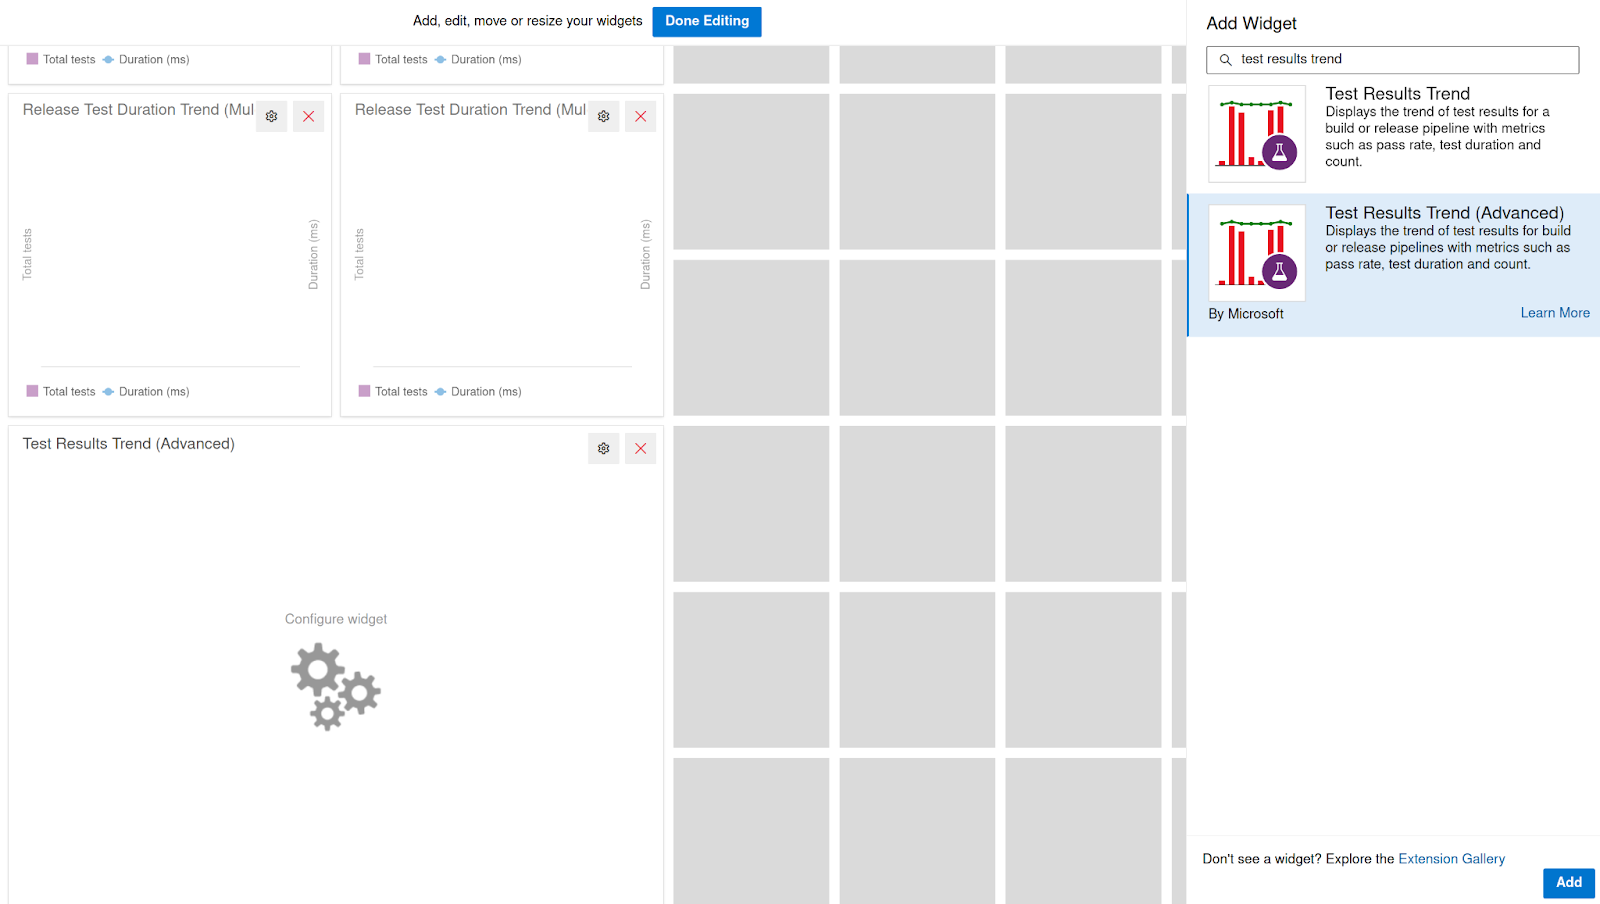
After your dashboard is created, it’s time to add widgets to it. Click on the ‘Edit’ button and then on the ‘Add a widget’ button. Azure DevOps provides many widgets that can display test results, such as:
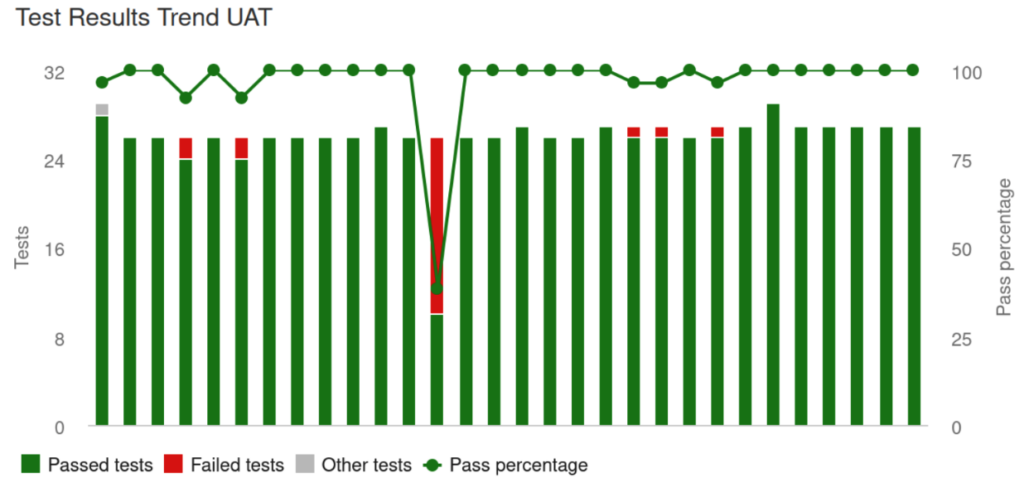
- Test Result Trend (displays the trend of test results over time and provides critical metrics)
- Test Result Trend (Advanced) (displays the trend of test results over time and provides a large number of metrics)
Add any widgets you find relevant by clicking on them, setting their properties, and then clicking on the ‘Add’ button. Once you’ve added all your widgets, click on ‘Done Editing’.
4. Customize Widgets
Each widget can be configured and customized to display data in a way that best suits your needs.
Suppose you want to set up a dashboard that will display test results and their passing rate.
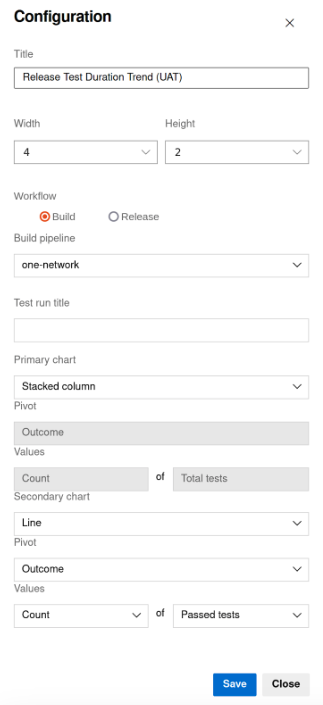
Click on the settings icon on the widget, and adjust its properties as needed:
- Select needed pipeline
- Set a Primary chart to show the outcome count of all tests
- Set a Secondary chart to the percentage of passed tests
- click on the ‘Save’ button.
Once you’re satisfied with your dashboard, it can be shared with your team.
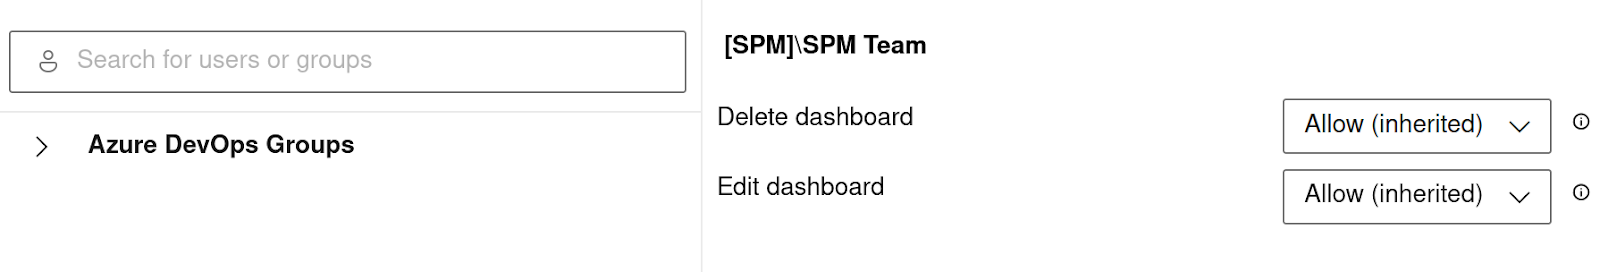
- Click on the Dashboard ‘Settings’ button
- Choose the ‘Manage permissions for this dashboard’ settings
- Select the team or team members with whom you want to share it
- Give them the appropriate permissions so they can see it
- Click on Save.
Valuable metrics
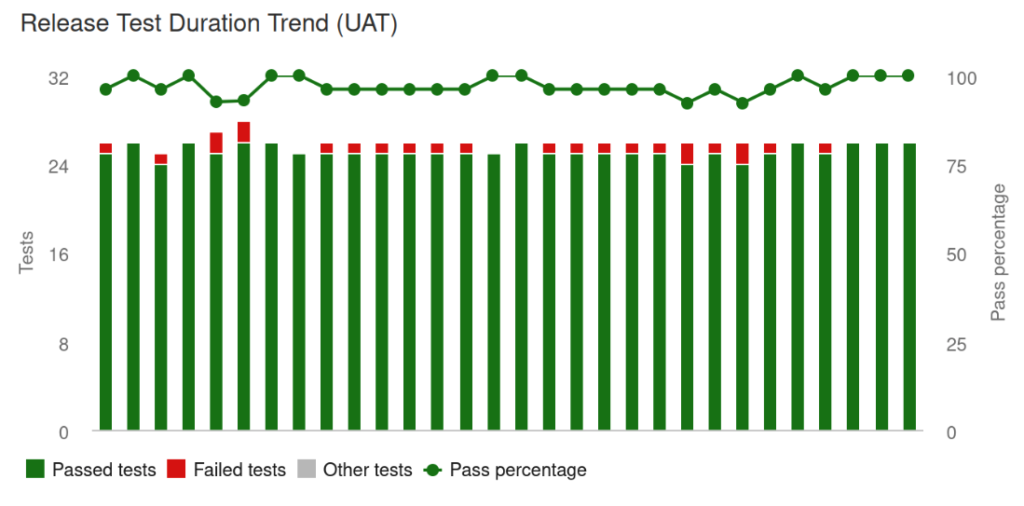
Count of Passed Tests:
This metric represents the number of tests that have successfully passed without any failures or errors. A passed test typically indicates that the specific test scenario or requirement has been met without any issues.
Count of Failed Tests:
This refers to the number of tests that did not pass and encountered errors or discrepancies. A failed test can signify potential defects or issues in the software.
Count of Other Tests:
This captures tests that neither passed nor failed but had some other status. This could include tests that were skipped, inconclusive, or aborted for some reason.
Percentage of Passed Tests:
This metric is calculated by taking the number of passed tests and dividing it by the total number of tests, then multiplying by 100 to get a percentage. It provides a ratio to understand the proportion of tests that were successful.
Count of Total Tests:
The sum of all tests executed, regardless of their result. This includes passed, failed, and other tests. It gives a holistic view of the test coverage and the extent of testing.
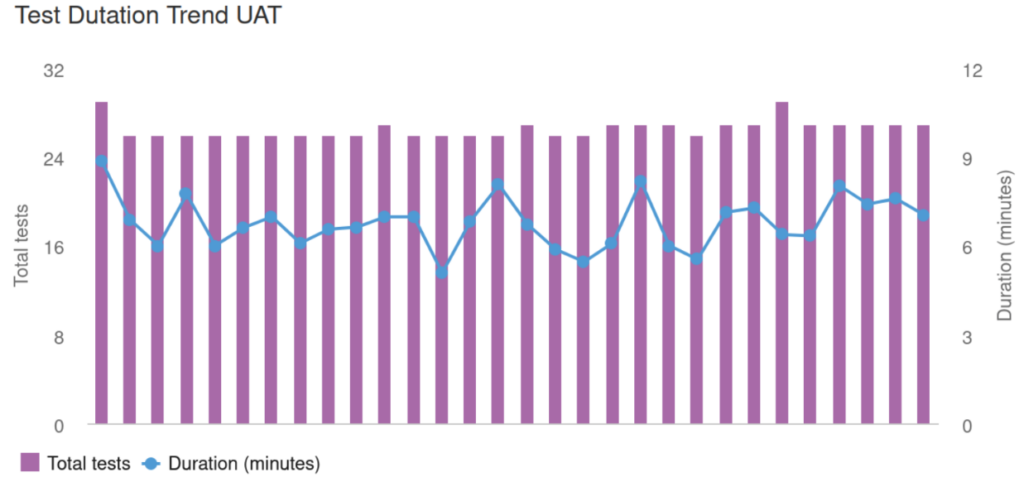
Run Duration:
This refers to the time taken to execute the entire test suite or a specific set of tests. This metric is vital for understanding the efficiency of the tests and identifying opportunities for optimization, especially in continuous integration/continuous deployment (CI/CD) environments where quick feedback is essential.
Conclusion
The Dashboards are flexible tools in Azure DevOps, so don’t hesitate to experiment with different widgets and configurations to find what works best for your team. Over time, the dashboard can become a powerful visualization of the progress and quality of your tests, offering actionable insights to keep your project on track.
In conclusion, Azure DevOps dashboards are an excellent tool for managing and visualizing test results in real-time. They provide a transparent view of the testing process, enabling teams to react quickly to changes and maintain the pace of development.