
Introduction
Performance Testing is crucial for ensuring your application can handle high user loads and concurrent actions effectively. This type of testing is essential to identify and resolve any potential performance bottlenecks, ensuring that the application performs optimally under various conditions, including scenarios with thousands of simultaneous users or multiple concurrent operations.
Grafana k6 is designed to simulate real-world load scenarios, providing us with detailed insights into how our application behaves under stress. By integrating k6 into our performance testing strategy, we can rigorously test our application’s endurance and responsiveness, ensuring it meets the high standards required for user satisfaction and system reliability.
Why choose k6?
k6 is designed to be flexible, allowing testers to write scripts in JavaScript, a widely-known language. This flexibility is crucial when simulating complex user behaviors and custom load scenarios. Moreover, k6 excels in scalability, handling both small-scale and large-scale load tests involving millions of simultaneous virtual users. This scalability ensures that k6 suits various applications, from small startups to large enterprises.
As an open-source tool, k6 benefits from the contributions and oversight of a vibrant community. This means that the tool is continually improving and evolving and that users have access to a wealth of community-generated resources, support, and best practices.
Installation and Setup
k6 has packages for Linux, Mac, and Windows.
- Linux Debian/Ubuntu:
sudo gpg -k
sudo gpg --no-default-keyring --keyring /usr/share/keyrings/k6-archive-keyring.gpg --keyserver hkp://keyserver.ubuntu.com:80 --recv-keys C5AD17C747E3415A3642D57D77C6C491D6AC1D69
echo "deb [signed-by=/usr/share/keyrings/k6-archive-keyring.gpg] https://dl.k6.io/deb stable main" | sudo tee /etc/apt/sources.list.d/k6.list
sudo apt-get update
sudo apt-get install k6
- MacOS using Homebrew:
brew install k6
- Windows:
Using Chocolatey package manager
choco install k6
Using Windows Package Manager
winget install k6 --source winget
To check if it is installed, type the following command:
k6 version
Writing Your First k6 Test Script
Creating a basic load-testing script in k6 involves writing a JavaScript file that defines how virtual users (VUs) will interact with your system. Let’s create the first k6 script:
Step 1: Set Up Your Test Parameters
Start by defining the configuration of your test. This includes the number of virtual users and how long they’ll run. You can set these parameters using the options object in k6.
export const options = {
  vus: 10, // Number of virtual users
  duration: '30s', // Duration of the test
};
This configuration will simulate 10 VUs for 30 seconds.
Step 2: Write the Default Function
The default function defines each VU’s actions. Each VU executes it repeatedly throughout the test’s duration.
export default function () {
  // Your testing logic will go here
}
Step 3: Make HTTP Requests
You can make HTTP requests to the target endpoints inside the default function. k6 provides the http module to make various types of HTTP requests. For a simple GET request:
import http from 'k6/http';
export default function () {
  http.get('http://test.k6.io');
}
This will send GET requests to http://test.k6.io.
When conducting performance testing with k6 or any other tool, always ensure that you have explicit permission to test the target system.
Step 4: Add Checks for Validation
k6 allows you to add checks to your test to validate responses. Checks are like assertions that return a boolean value indicating success or failure.
import http from 'k6/http';
import { check } from 'k6';
export default function () {
  let response = http.get('http://test.k6.io');
  check(response, {
    'is status 200': (r) => r.status === 200, // Check if response status is 200
  });
}
Step 5: Simulate Real User Pauses
Real users often wait between actions (e.g., reading a page or filling out forms). You can simulate this using the sleep function.
import http from 'k6/http';
import { check, sleep } from 'k6';
export const options = {
  vus: 10, // Number of virtual users
  duration: '30s', // Duration of the test
};
export default function () {
  let response = http.get('http://test.k6.io');
  check(response, {
    'is status 200': (r) => r.status === 200,
  });
  sleep(1); // Wait for 1 second
}
Running Your First Load Test
Executing your test script with k6 is straightforward and primarily done through the command line. Here’s a step-by-step guide to help you run your first load test:
Step 1: Open Your Command Line Interface
Open your command line interface (CLI). This could be Command Prompt on Windows, Terminal on macOS, or any terminal emulator on Linux.
Use the cd (change directory) command to navigate to the directory where your test script is located. For example:
cd path/to/folder
Step 3: Run the Test
To execute the test, use the k6 command run, followed by the name of your script:
k6 run script.js
Understanding Command-Line Options
k6 offers various command-line options to customize your test runs. Here are some commonly used options:
- Virtual Users (VUs):
-uor--vusto specify the number of VUs. For example,k6 run -u 50 script.jsfor 50 VUs. - Duration:
-dor--durationto set the test duration. For example,k6 run -d 30s script.jsfor a 30-second test. - Stages:
--stageor usingstagesin your script to define a step-up load test. For example,k6 run --stage 30s:50,60s:100 script.jsto ramp up to 50 VUs in 30 seconds, then 100 VUs in the next 60 seconds. - Output:
--outto define the output format and destination for results, like a file or an external service. For examplek6 run--out json=test.jsonscript.js
Analyzing Results
After you’ve run a load test using k6, it’s crucial to understand the results to make informed decisions about your application’s performance.
Key Metrics to Consider
- Response Time: This includes metrics like:
Average response time: The average amount of time it takes for the server to respond to requests during the test.Median response time: This is the middle value of your response times, indicating typical response behavior.Percentile response times(e.g.,p95,p99): These show the response time threshold for the fastest 95% or 99% of requests, indicating how the application performs under the heaviest loads.
- Requests Per Second (RPS): This is the number of requests your application can handle each second. A higher RPS indicates better performance and ability to handle more traffic.
- Error Rates: The percentage of failed requests compared to the total requests made. High error rates could indicate problems with the server, network, or the test script itself.
Interpreting the Results
- Identifying Bottlenecks: Look for unusually high response times or low RPS, which can indicate performance bottlenecks.
- Understanding Server Limits: Consistent increase in response times or error rates as the number of VUs increases can help identify your server’s capacity limits.
- Comparing to Benchmarks: Compare your results with your performance benchmarks to determine if your application meets the expected performance standards.
- Error Analysis: If your error rate is high, investigate the types of errors. Common issues might include timeout errors, connection refusals, or server error responses (like 5xx HTTP status codes).
Advanced Features
k6 offers several advanced features and capabilities, allowing more comprehensive and tailored load testing. These include scenarios, thresholds, and extensions, each offering unique benefits for different testing requirements.
Scenarios
- What They Are: Scenarios in k6 enable you to define complex load-testing patterns. You can simulate various user behaviors and model different traffic patterns on your system.
- When to Use: Scenarios are particularly useful when simulating real-world conditions, like spike tests, stress tests, and soak tests. For instance, you can create a scenario where the load gradually increases to test how your system scales or another where it mimics a sudden surge in traffic.
- Example:
export let options = {
    scenarios: {
      peak_traffic: {
        executor: 'ramping-vus',
        startVUs: 10,
        stages: [
          { duration: '10m', target: 100 }, // Ramp-up
          { duration: '1h', target: 100 },  // Sustain peak
          { duration: '10m', target: 0 },   // Ramp-down
        ],
      },
    },
  };
Thresholds
- What They Are: Thresholds are a way to define pass/fail criteria for your tests in k6. You can set performance objectives, like maximum response times or acceptable error rates.
- When to Use: Thresholds are ideal when enforcing performance standards. They are especially useful in continuous integration environments where you must automatically determine if a build passes based on its performance.
- Example:
export const options = {
    thresholds: {
      'http_req_duration': ['p(95)<500'], // 95% of requests must complete below 500ms
      'http_req_failed': ['rate<0.01'],   // Error rate must be below 1%
    },
  };
Extensions
- What They Are: k6 supports extensions that allow you to extend its functionality. These can include custom metrics, new protocol support, or integration with external systems.
- When to Use: Use extensions when K6’s standard capabilities don’t cover your specific needs. For example, you might need to test a custom protocol or integrate test results with a specific monitoring tool.
- Example: Using xk6 to build a html report
go install go.k6.io/xk6/cmd/xk6@latest
xk6 build --with github.com/grafana/xk6-dashboard@latest
Integrations and CI/CD
Integrating k6 into Continuous Integration (CI) and Continuous Deployment (CD) pipelines enhances the software development process by automating performance testing. This integration ensures that performance benchmarks are consistently met with each new build or deployment. Here’s how you can integrate k6 into your CI/CD workflows:
Integrating k6 into CI/CD Pipelines
- Script Incorporation: Include your k6 test scripts in your project repository. These scripts should be accessible to the CI/CD pipeline.
- Pipeline Configuration: Modify your CI/CD pipeline configuration to include a step for running K6 tests. This typically involves adding a command to execute the K6 script during testing.
- Thresholds for Automated Decision Making: Use k6’s threshold feature to set performance criteria. The CI/CD pipeline can use these criteria to automatically pass or fail a build based on the performance outcomes.
- Environment Variables and Secrets: If your k6 scripts require specific configurations or credentials, use environment variables or secrets management features of your CI/CD platform to securely pass these values.
- Handling Test Results: Configure the pipeline to handle k6 test result outputs. You can store these results for later analysis or integrate them with monitoring tools for real-time feedback.
Azure Pipelines integration with k6
To generate the .xml report, you need to add the following expression at the end of your performance testing script:
export function handleSummary(data) {
  return {
    'stdout': textSummary(data, { indent: ' ', enableColors: true}),
    './eapi-bms-proxy-hq-k6-results.xml': jUnit(data),
  };
}
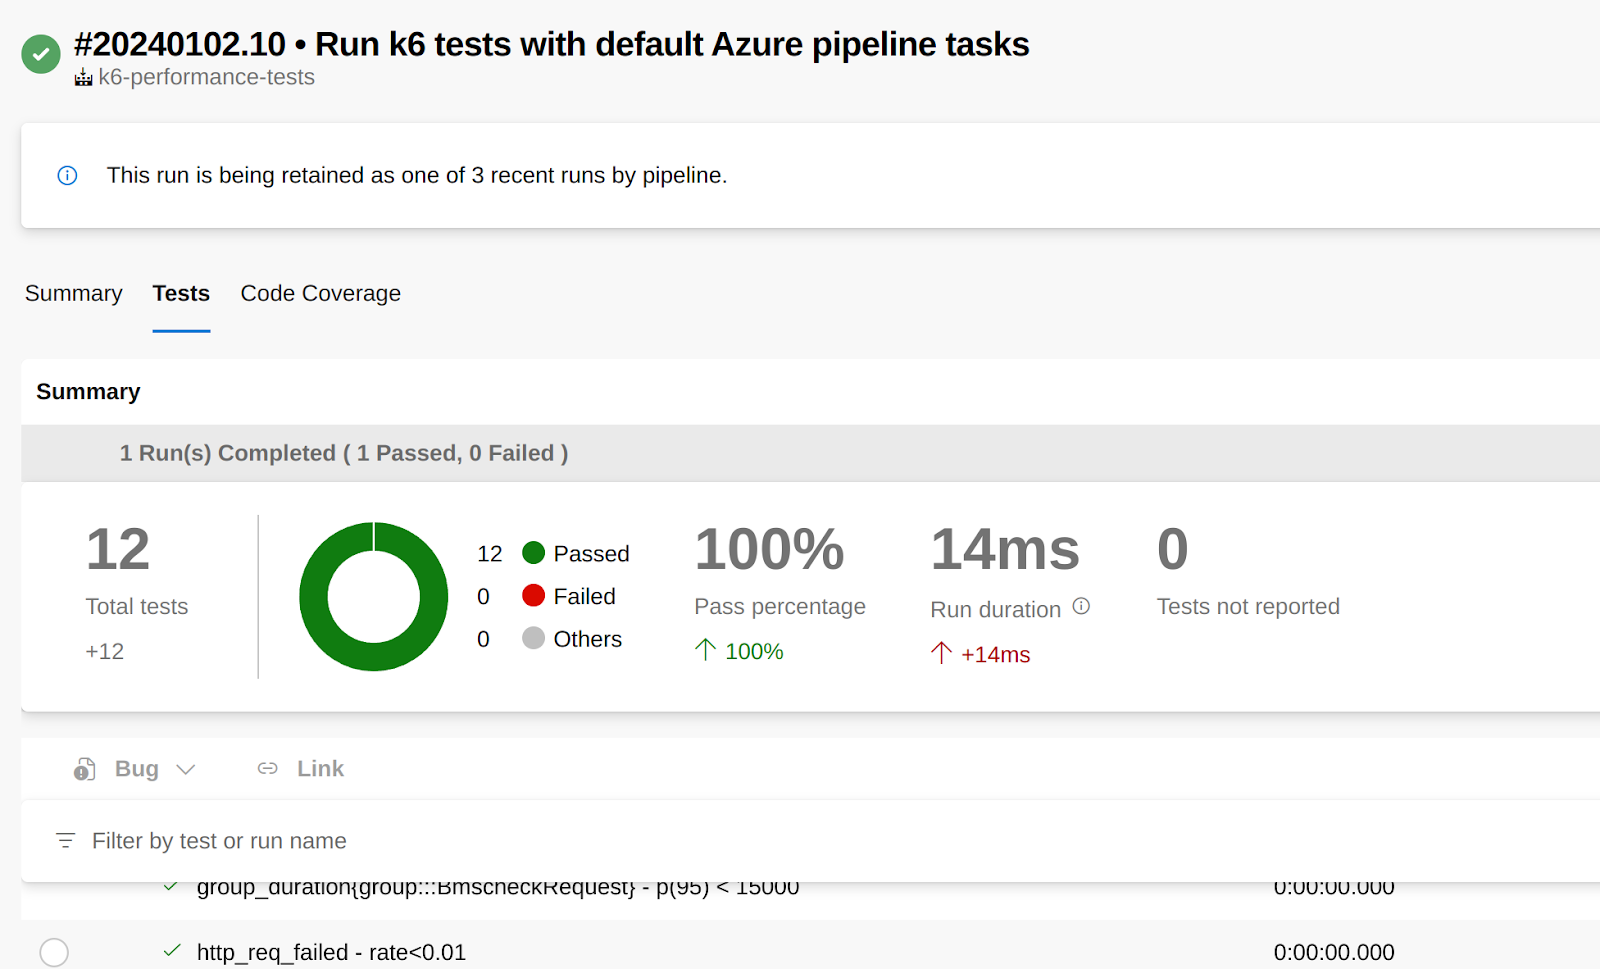
Here’s a simple example of how Azure pipeline script might include a k6 test:
trigger:
- main
pool:
  vmImage: 'ubuntu-latest'
jobs:
- job: RunK6Tests
  steps:
  - task: k6-load-test@0
    displayName: 'Run with k6'
    inputs:
      filename: '$(System.DefaultWorkingDirectory)/tests/load-test.js'
    continueOnError: true
    condition: succeededOrFailed()
  - task: PublishTestResults@2
    displayName: 'Publish Test Results **/k6-results.xml'
    inputs:
      testResultsFiles: '**/*-k6-results.xml'
      failTaskOnFailedTests: true
      failTaskOnMissingResultsFile: true
    condition: always()
The output will look like this:
Best Practices
To get the most out of your load testing with k6, it’s crucial to follow certain best practices. These practices ensure that your tests are effective and accurate and provide valuable insights. Here are some key tips and best practices:
Effective Scripting
- Modularize Your Code: Break down your scripts into functions and modules. This makes your code more readable and maintainable. Reuse common code across different test scripts, such as API requests or utility functions.
- Use Realistic Scenarios: Simulate real user behavior as closely as possible. Include think times (delays), realistically handle user sessions and authentication, and model the full journey of various user types.
- Environment Parameterization: Make your scripts flexible by using environment variables for different environments (staging, production, etc.) and varying test parameters (like VU numbers and durations).
Designing Test Scenarios
- Incremental Load Testing: Start with fewer users and gradually increase the load. This approach helps identify the application’s performance thresholds and breaking points.
- Different Types of Tests: Implement various types of tests such as smoke, stress, and spike tests. Each type provides different insights into how your application behaves under specific conditions.
- Realistic Load Distribution: Distribute the load realistically across your application’s different endpoints or functionalities. Not all parts of your system will face the same traffic patterns.
Efficient Reporting and Analysis
- Set Meaningful Thresholds: Define clear and meaningful thresholds for pass/fail criteria in your tests. This helps in automating decisions in CI/CD pipelines.
- Use k6 Dashboards: K6’s integration with tools like Grafana can be used to visualize test results. Dashboards can provide deeper insights through real-time graphs and long-term trend analysis.
- Continuous Monitoring: Regularly monitor and analyze the performance trends. This helps in proactively identifying and addressing performance degradation.
- Analyze Failures Thoroughly: If tests fail, analyze logs and metrics thoroughly to identify the root cause. Look at network, server, and application logs for a complete picture.
Conclusion
In summary, k6 stands out as a powerful and versatile tool for load testing, offering a range of features and benefits that make it an excellent choice for both novice and experienced testers. Here are the key takeaways from our discussion:
- Ease of Use: k6’s user-friendly nature, characterized by its straightforward setup and JavaScript-based scripting, makes it accessible for beginners while still offering advanced capabilities for experienced users.
- Realistic Load Scenarios: With k6, you can simulate real-world user behaviors and complex load scenarios, allowing for a more accurate assessment of your application’s performance under various conditions.
- Scalability and Flexibility: Whether you’re testing a small application or a large enterprise system, k6 scales to meet your needs, offering the flexibility to test different environments and configurations.
- Open-Source Community: Being open-source, k6 benefits from community contributions, ensuring continuous improvement and a wealth of resources and support.
- CI/CD Integration: k6 can be seamlessly integrated into CI/CD pipelines, making it easier to incorporate performance testing into your development process and ensure continuous performance monitoring.
- Actionable Insights: With its detailed reporting and threshold-based analysis, k6 provides actionable insights, helping you to identify and rectify performance bottlenecks.
Starting with k6:
We encourage you to start incorporating k6 into your projects. Whether you’re looking to improve the performance of an existing application or ensure the scalability of a new one, k6 offers the tools and capabilities you need to achieve comprehensive and reliable load-testing results. Dive into k6, explore its features, and see how it can enhance the performance testing aspect of your software development lifecycle. Remember, a well-tested application is key to a successful user experience and overall product success.
References
https://k6.io/docs/get-started/installation/
https://k6.io/docs/get-started/running-k6/
https://k6.io/docs/using-k6/k6-options/
https://k6.io/docs/get-started/results-output/
https://k6.io/docs/using-k6/metrics/
https://k6.io/docs/using-k6/thresholds/
https://k6.io/docs/using-k6/scenarios/
https://k6.io/docs/testing-guides/api-load-testing/
https://github.com/grafana/xk6-dashboard